Dashboard
Your home screen for "where do I stand today?" — headline totals, net-worth trend, how you're split across holdings, and the detail behind every line. It opens by default.
How to use
- Open the filters and narrow the view by Account, Asset, Risk, Category, Provider, or Ticker. Each accepts more than one choice; leave one empty to include everything in it.
- Keep Hide empty on to drop holdings you no longer hold; turn it off to see them. Use Reset to clear all filters.
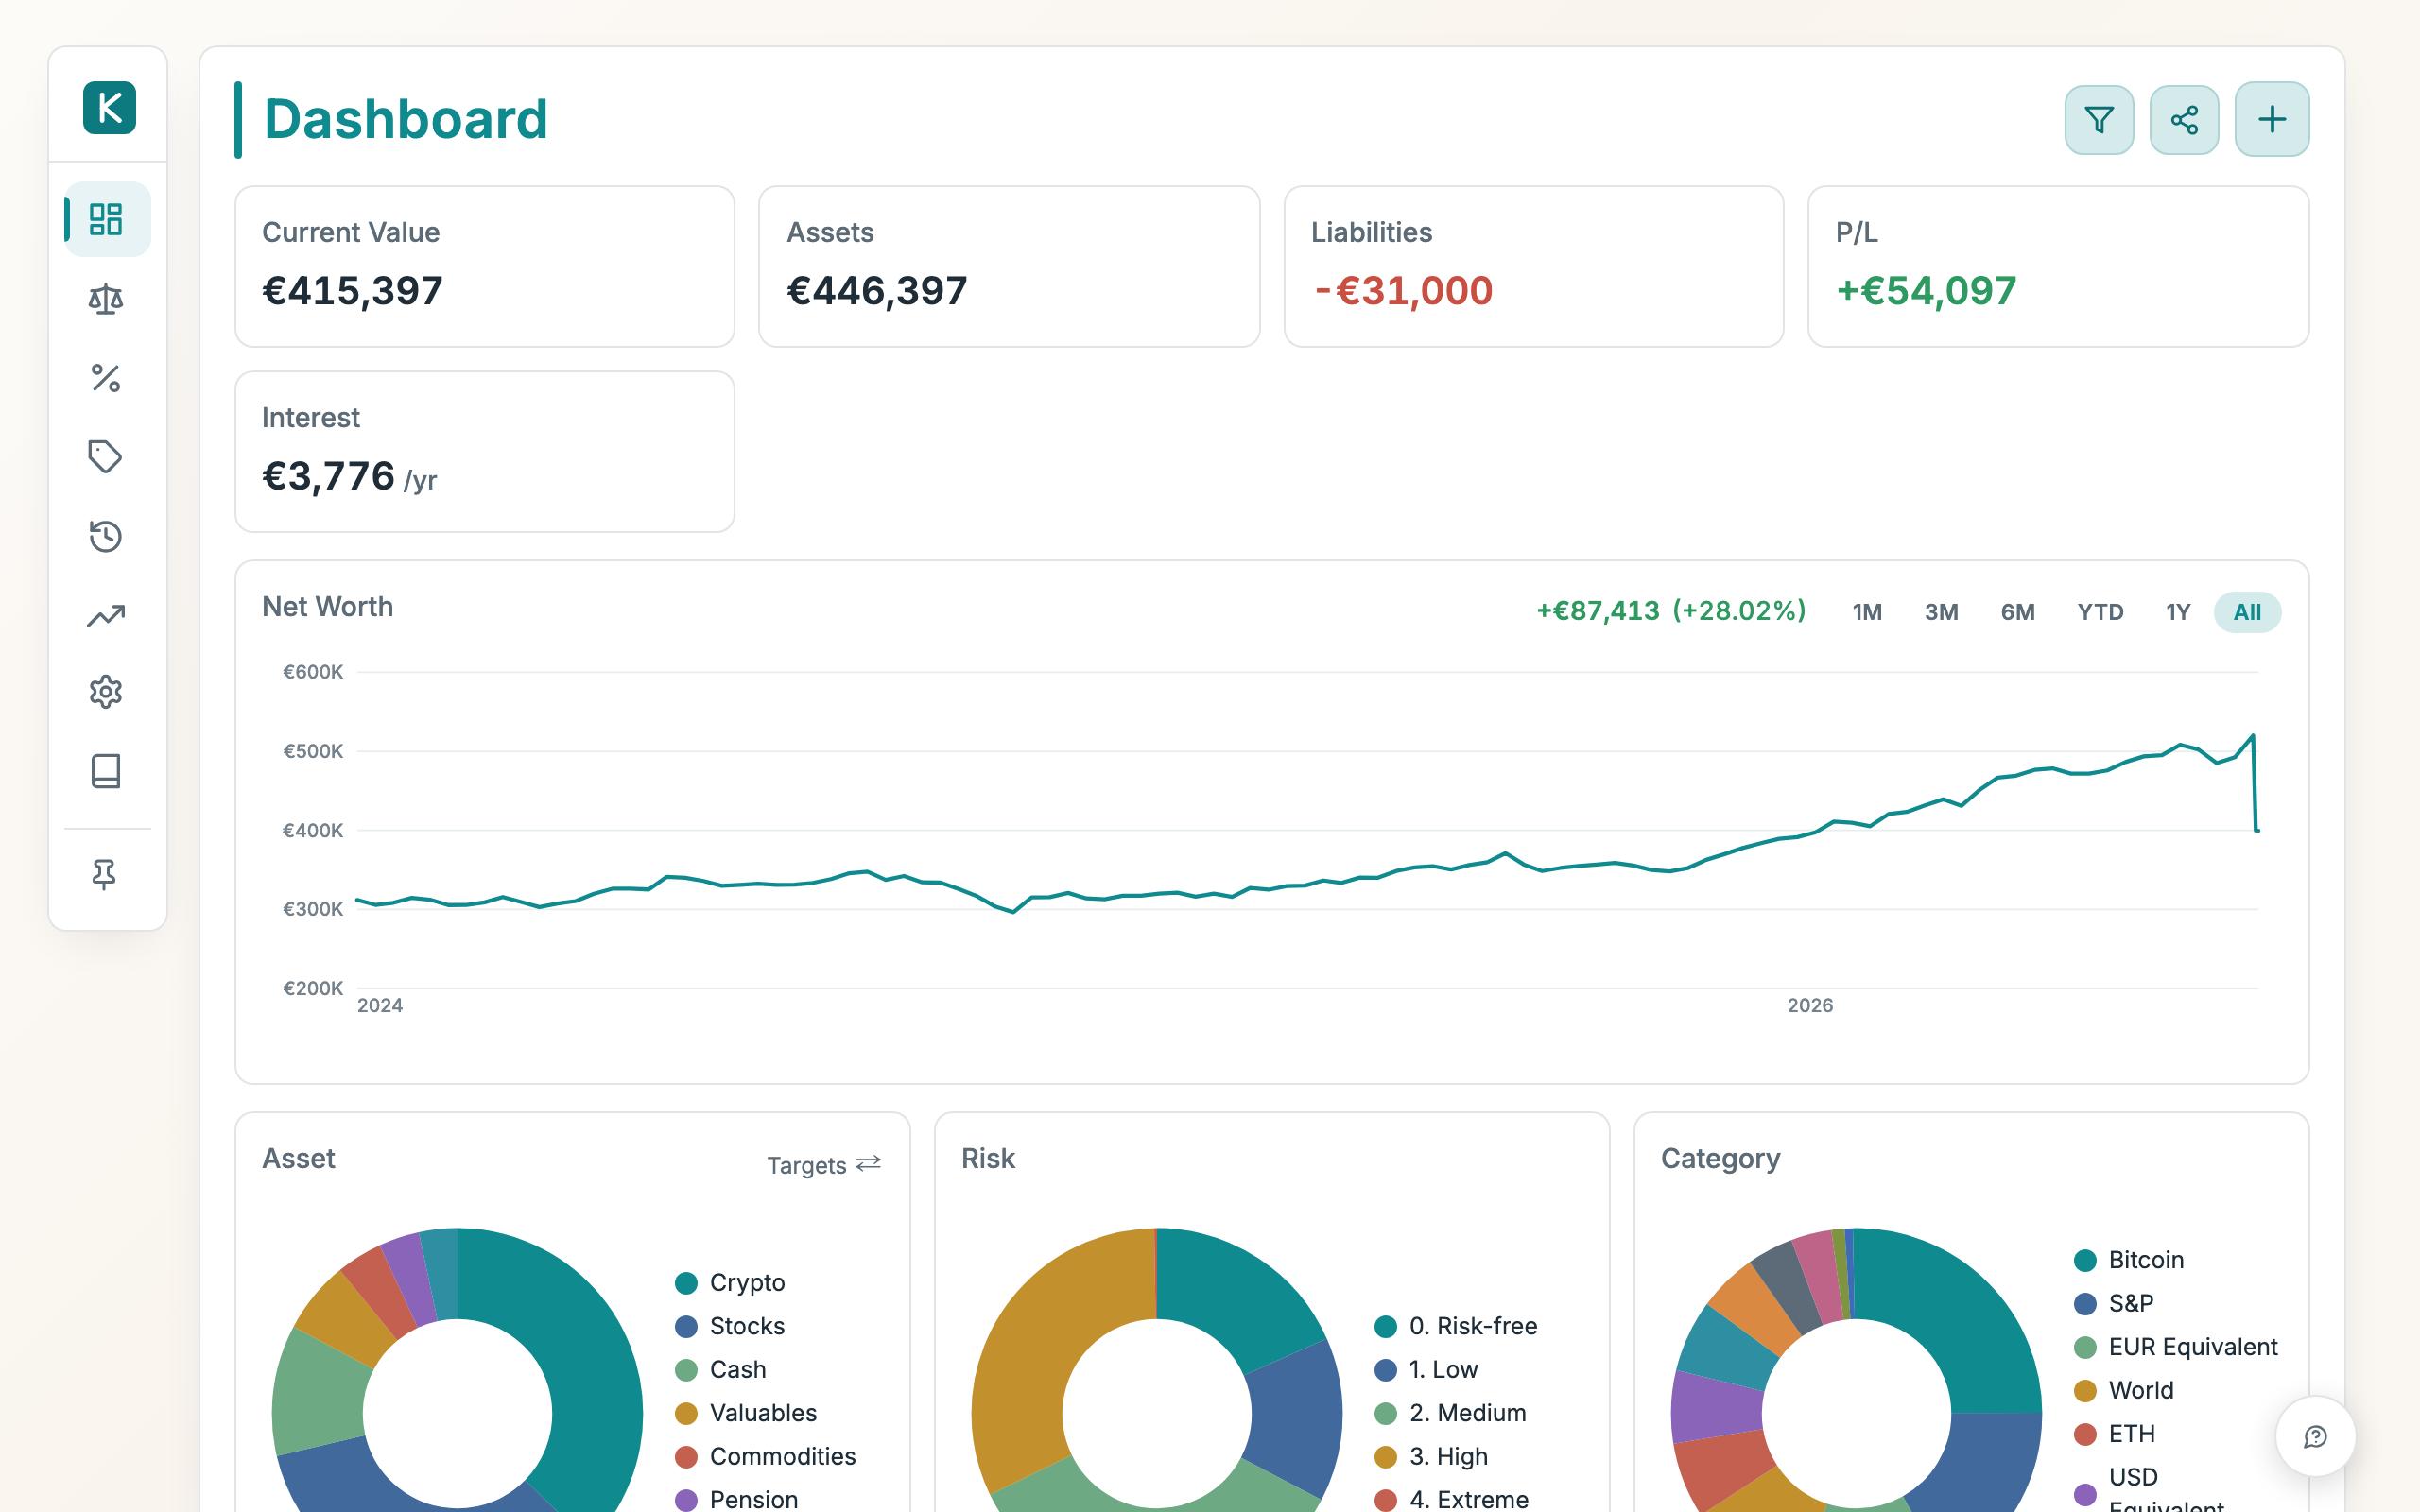
- Read the cards at the top: Current Value, P/L, and Interest. When you hold debts, Assets and Liabilities cards also appear. Click any money figure to flip it between euros and dollars.
- Watch the Net Worth History chart for your daily trend.
- Use the donut charts below it — Account, Asset, Risk, Category, Provider, Ticker — to see how you're split.
- Drill into individual positions in the detail table at the bottom. Click a column heading to sort.
- Use Add to log a trade or a holding, or Share snapshot to send the current picture.
Good to know
- The net-worth trend counts every priced holding. To leave something out — a pension you can't touch, say — filter it out, save it as your Default view with the bookmark button, then turn on Apply to net worth in Settings. See Settings.
- Ad-hoc filters and Hide empty change the cards, donuts, and table, but not the trend chart. Only a saved Default view with Apply to net worth on reshapes the trend, and only from then on — past days aren't rewritten.
- The trend records one point per day automatically, whether or not you open the app.
- The filters are shared across the Dashboard, Balance Sheet, Interest, History, and Prices — change them on one tab and they change everywhere.